
The Australian Threatened Species Index (TSX) is two things at its core:
- A continental-scale database of thousands of threatened species monitoring projects.
- A quantitative index that measures changes in the abundance of Australia’s threatened and near-threatened species over time.
The TSX is the first endeavour to synthesise monitoring data on threatened species from right across Australia. These data often only exist in a raw form in State and Territory repositories, in papers, reports or theses, or even on personal computers or hard-copy files. Over the last 6 years, the TSX team have steadily worked to bring such data together for birds, plants and mammals, and will pursue monitoring data for other species groups in the years to come. Data has been received from over 230 sources from over 10,000 sites across the Australian mainland and our island territories. The present TSX database contains data on 278 Australian Threatened and Near Threatened bird, mammal and plant species and subspecies. It combines 19,893 time series of species monitoring data, totally around 140,000 monitoring years (the sum of the number of monitoring years across all the time-series). To help streamline the cleaning, processing and analysis of this data we have created an automated scientific workflow, which has now been integrated into our TSX data management interface, accessible to all data providers.
Using this incredible dataset, that continues to grow each year, we can create a quantitative index that measures the change in the abundance of Australia’s threatened and near-threatened species over time. To create this index we have used the Living Planet Index approach. The Living Planet Index (LPI) was designed by the World Wildlife Fund and the Zoological Society of London. The LPI tracks changes in global vertebrate biodiversity through time and is used to report against international targets such as those of the Convention on Biological Diversity. It compiles data from published scientific literature and accessible reports and web pages to track the population abundance of thousands of mammals, birds, fish, reptiles and amphibians around the world.
The overall multi-species index (Figure 1) is calculated as a geometric mean over many single-species trends combining them into a composite index. Component trends are also calculated, allowing users to explore trends for different states and territories (e.g., Queensland), species groups (e.g. shorebirds), or a combination thereof (e.g., Queensland shorebirds). This can be done using our TSX visualiser tool. Using the tool you can also assess how representative the trend is based on the species/subspecies included and the spatial representativeness of the data.
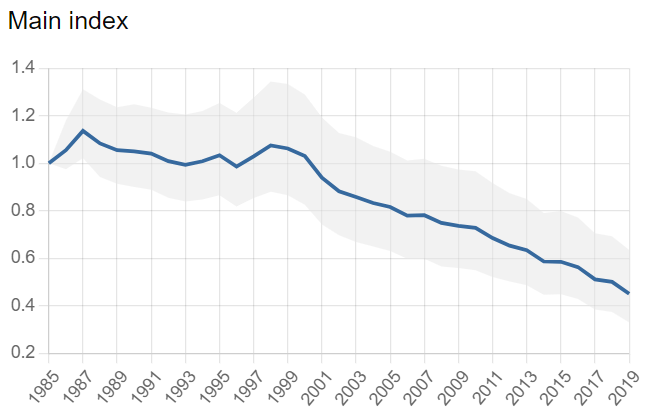
Each index plot shows the average change in populations compared to a base year. It shows a relative change and not population abundance itself. At the reference year, the index gets a score of one. A score of 1.2 means a 20% increase on average compared to the reference year, while a score of 0.8 means a 20% decrease on average compared to the reference year. The uncertainty cloud around each index (95% confidence intervals) shows the range of trends for the individual species that make up the index. It can be seen as the variability between single-species trends that build the composite.