Learn about the main results of the Threatened Bird Index from the TSX Team:
Threatened Bird Index for Australia 2018
Interpreting the index graphs
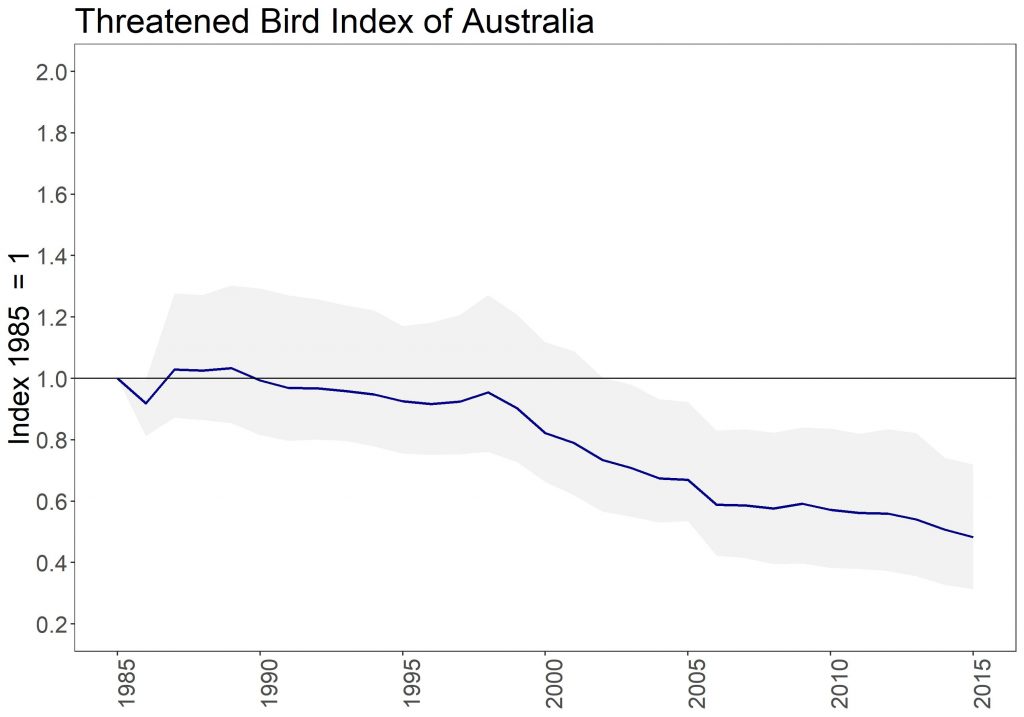
The index shows the average change in populations compared to a base year. It shows a relative change and not population numbers themselves. The base year of our index is 1985, which gets an index score of one. A score of 1.2 would mean a 20% increase compared to numbers in 1985 on average, while a score of 0.8 would mean a 20% decrease compared to 1985 on average.
The Living Planet Index team has produced a blog which illustrates how the numbers are typically crunched to produce an index. This is the same for the calculation of the Threatened Species Index.
Threatened Species Index for Australian Birds 2018
The 2018 index for threatened birds in Australia shows us that between 1985 and 2015 there was a 52% decrease on average in threatened Australian bird populations for which we have data.
The index is based upon data for many species and subspecies. At this stage, 43 threatened birds are included. These represent about 28% of all nationally listed threatened birds.
Within this, some species have decreased a bit more and others a bit less. The grey cloud around the index trend represents some of the variability in the trends of individual species that make up the overall multi-species index. It is created by randomly sampling species trends from all possible trends in the dataset 100 times, and dropping the 5 trends that are furthest from the average, resulting in a 95% “confidence limit”.
In addition to the Australian index, our web visualisation tool allows you to generate indices for all Australian states and territories and for a range of species groups and other options.
More details on the Australian index and all state and territory indices can be found in our research findings fact sheets, developed with the Commonwealth Department of the Environment and Energy and all state and territory governments.