
Learn about the main results of the Threatened Mammal Index from the TSX Team:
Threatened Mammal Index for Australia 2019 for all sites
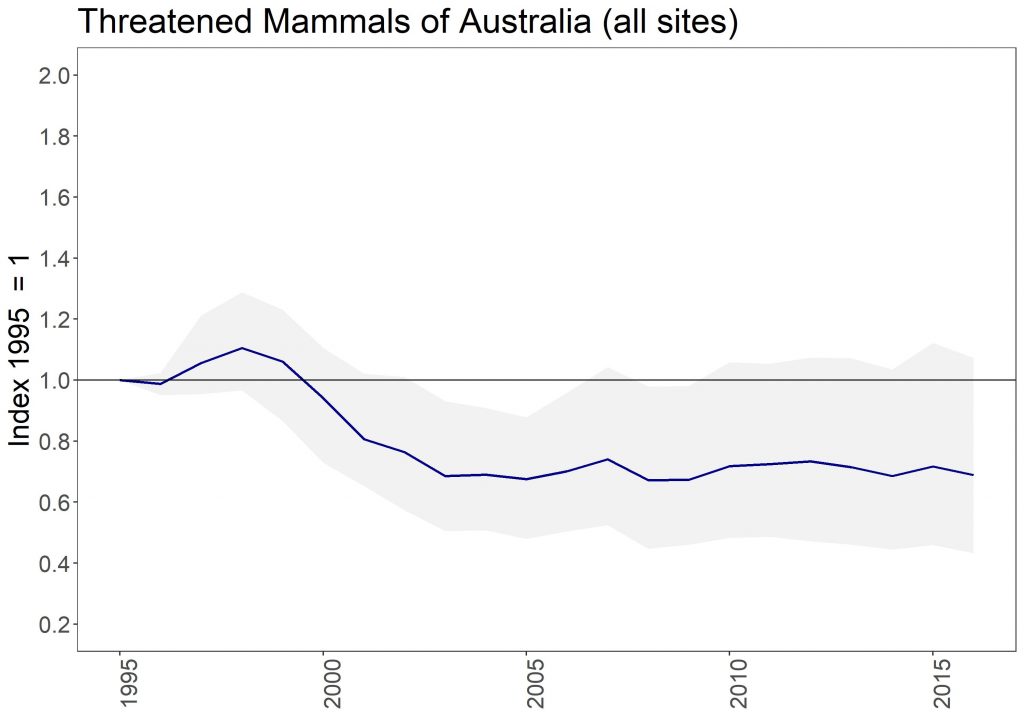
Interpreting the index graphs
The index shows the average change in populations compared to a base year. It shows a relative change and not population numbers themselves. The base year of this index is 1995, which gets an index score of one. A score of 1.2 would mean a 20% increase compared to numbers in 1995 on average, while a score of 0.8 would mean a 20% decrease compared to 1995 on average.
The Living Planet Index team has produced a blog which illustrates how the numbers are typically crunched to produce an index. This is the same for the calculation of the Threatened Species Index.
Threatened Species Index for Australian Mammals 2019
The 2019 index for threatened and near-threatened mammals in Australia shows us that between 1995 and 2016 there was a 38% decrease on average in Australian mammal populations across all sites for which we have data.
For mammals, we can also look at how mammals are doing at sites with and without conservation management such as invasive predator control, fire management and feral predator-free havens like islands and fenced areas. At sites where conservation actions have occurred, like feral animal control and/or ecological fire management on average populations have increased by 46%. While at sites where no conservation actions have occurred populations have decreased by over 60% on average. The separation of mammal sites into sites with and without conservation management is based on information communicated by our data custodians.
The overall index is based upon data for many species and subspecies. The mammal index developed throughout 2019 includes data for 57 threatened and near-threatened mammals from 1,186 sites. As more data is added these numbers will grow.
Within this, some species have decreased a bit more and others a bit less. The grey cloud around the index trend represents some of the variability in the trends of individual species that make up the overall multi-species index. It is created by randomly sampling species trends from all possible trends in the dataset 100 times, and dropping the 5 trends that are furthest from the average, resulting in a 95% “confidence limit”.
In addition to the Australian index, our web visualisation tool allows you to generate indices individual Australian states and territories and for a range of species groups, such as marine and terrestrial mammals. The mammal index has also the option to show sub-indices based on mammal weight categories e.g. <50g, 50-5000g, and >5000g.
More details on the Australian index and all state and territory indices can be found in our research findings factsheets. This project and the factsheets were developed in collaboration with the Commonwealth Department of the Agriculture, Water and the Environment, and all of our major data contributors, including all state and territory governments, and the Australian Wildlife Conservancy and Arid Recovery.
Threatened Species Index for Mammals 2019 findings factsheets:
Northern Territory (PDF, 2.9MB)
Western Australia (PDF, 2.6MB)
Data sources
The current Threatened Species Index for Australian mammals include data sources from the following institutions/reports:
- Annual population estimates of Southern Elephant Seals at Macquarie Island from censuses made annually on October 15th – Department of Primary Industries, Parks, Water and Environment. Extracted from Australian Antarctic Data Centre – CAASM Metadata. Australian Antarctic Data Centre Elephant Seal Census
- Antechinus argentus monitoring survey. Compiled by Stephane Batista
- Antechinus arktos monitoring survey. Compiled by Stephane Batista
- Arid Recovery Monitoring. Compiled by Georgina Neave
- Australian Sea-lion Monitoring – Department of Biodiversity, Conservation and Attractions, WA. Compiled by Simon Goldsworthy
- Australian Sea-lion Monitoring Department for the Environment and Water (DEW) & South Australian Research and Development Institute (SARDI). Compiled by Simon Goldsworthy
- AWC Brooklyn Wildlife Sanctuary Spatial Mark-Resight Trapping (Northern Quoll). Compiled by Fay Lewis
- AWC Buckaringa Wildlife Sanctuary Yellow-footed Rock-wallaby Monitoring. Compiled by Fay Lewis
- AWC Newhaven Wildlife Sanctuary Black-footed Rock-wallaby Activity Surveys. Compiled by Fay Lewis
- AWC Paruna Wildlife Sanctuary Black-flanked Rock-wallaby Trapping. Compiled by Fay Lewis
- AWC Piccaninny Plains Wildlife Sanctuary Camera Trapping (Black-footed Tree-rat). Compiled by Fay Lewis
- AWC Piccaninny Plains Wildlife Sanctuary Spatial Mark-Resight Trapping (Carpentarian Antechinus). Compiled by Fay Lewis
- AWC Pungalina-Seven Wildlife Sanctuary Spatial Mark-Resight Trapping (Carpentarian Antechinus). Compiled by Fay Lewis
- AWC Scotia Wildlife Sanctuary Bilby Monitoring. Compiled by Fay Lewis
- AWC Scotia Wildlife Sanctuary Numbat Monitoring. Compiled by Fay Lewis
- AWC Yookamurra Wildlife Sanctuary Bettong Monitoring. Compiled by Fay Lewis
- AWC Yookamurra Wildlife Sanctuary Bilby Monitoring. Compiled by Fay Lewis
- AWC Yookamurra Wildlife Sanctuary Numbat Monitoring. Compiled by Fay Lewis
- Bilby Monitoring – Department of Biodiversity, Conservation and Attractions, WA. Compiled by Martin Dziminski
- Bilby monitoring program – Department of Environment and Science (DES). Compiled by John Augusteyn; source: Peter McRae
- Biological Databases of South Australia (BDBSA) data extract
- Bridled nailtail wallaby – UQ field course monitoring BIOL3016. Compiled by Diana Fisher
- Christmas Island Flying-fox island-wide survey
- Diamantina Pest Arrest Project (Kowari) – Department of Environment and Science (DES). Compiled by John Augusteyn
- Dibbler Recovery Program Monitoring – Department of Biodiversity, Conservation and Attractions, WA. Compiled by Tony Friend
- Forestry Corporation of NSW Long-nosed Potoroo Monitoring
- Gorgon Offset – Department of Biodiversity, Conservation and Attractions, WA. Compiled by Colleen Sims
- Humpback Whale Monitoring. Compiled by Angela Recalde Salas
- Idalia Pest Arrest project (Bridled Nailtail Wallaby) – Department of Environment and Science (DES). Compiled by John Augusteyn
- Kingston Project (Western Ringtail Possum) – Department of Biodiversity, Conservation and Attractions, WA. Compiled by Marika Maxwell
- Kowari monitoring – South Australian Arid Lands Natural Resources Management Board. Compiled by Rob Brandle and Catherine Lynch
- Landscape Conservation Initiative – Department of Biodiversity, Conservation and Attractions, WA. Compiled by Ian Radford
- Long-term Mountain Pygmy-possum monitoring
- Lowland Leadbeater’s Possum Population Monitoring. Compiled by Dan Harley
- Montebello Renewal – Department of Biodiversity, Conservation and Attractions, WA. Compiled by Colleen Sims
- Northern quoll monitoring – UQ. Compiled by Diana Fisher
- NT Government Top End Ecological Monitoring Program (Brush-tailed Rabbit-rat). Compiled by Brydie Hill
- NT Government Top End Ecological Monitoring Program. Compiled by Brydie Hill
- Numbat Recovery Program Monitoring – Department of Biodiversity, Conservation and Attractions, WA. Compiled by Tony Friend
- Oakey koala surveys (1972-2010)
- Point Lookout Humpback Whale Survey
- Qld Mulga Lands Koala Surveys
- Save The Tasmanian Devil Program Monitoring. Lazenby BT, Tobler MW, Brown WE, Hawkins CE, Hocking GJ, Hume F,
- Huxtable S, Iles P, Jones ME, Lawrence C, Thalmann S, Wise P, Williams H, Fox S, Pemberton D (2018)
- Data from: Density trends and demographic signals uncover the long-term impact of transmissible cancer in Tasmanian Devils
- Shark Bay World Heritage Threatened Species (Biodiversity Conservation Initiative – Caring for Country) and Dirk Hartig Island Return to 1616 Source population monitoring – Department of Biodiversity, Conservation and Attractions, WA. Compiled by Colleen Sims
- South East Queensland Koala Surveys – Department of Environment and Science (DES). Compiled by Harriet Preece. Data sourced from Koala Research Unit database, DES (1996-2013); Koala Survey Team, DES (2018); Hasagewa M (1995). Habitat utilisation by koalas (Phascolarctos cinereus) at Point Halloran, Queensland. MSc Thesis, The University of Queensland; White NA, Kunst ND (1988). A report on ecological research on population and habitat features of the koala in key sites in South Eastern Queensland, Internal report to Qld Parks and Wildlife Service
- Subantarctic Fur Seal Monitoring (South Australian Research and Development Institute (SARDI)). Compiled by Simon Goldsworthy
- Threatened Species Operations Monitoring – Department of Environment and Science (DES). Compiled by Ian Gynther, data sourced from WildNet
- Threatened Species Operations Monitoring (Large-eared Pied Bat) – Department of Environment and Science (DES). Compiled by Ian Gynther, data sourced from WildNet
- Tiwi Mammal Monitoring
- Upper Warren Region fauna monitoring – Department of Biodiversity, Conservation and Attractions, WA. Compiled by Marika Maxwell
- Victorian Biodiversity Atlas data extract – Victorian Department of Environment, Land, Water and Planning
- Water mouse monitoring
- Water mouse monitoring – Department of Environment and Science (DES). Compiled by Tina Ball
- Western Shield Monitoring – Department of Biodiversity, Conservation and Attractions, WA. Compiled by Michelle Drew
- Wombat – Internal Department of Environment and Science Report. Compiled by Alan Horsup
- Yellow-bellied Glider (Wet Tropics) Project – Queensland Parks and Wildlife Service. Compiled by John Winter
- Yellow-bellied glider monitoring Richmond Range National Park
- Yellow-footed Rock-wallaby – UQ field course monitoring BIOL3016. Compiled by Diana Fisher