Australian Sea Lion (Neophoca cinerea). Photo credit: Nicolas Rakotopare.
09 December 2024
The Threatened Species Index 2024
The TSX brings together thousands of monitoring datasets from across Australia and releases trend updates annually. In 2024, along with updates to the existing groups, a pilot Threatened Frog Index has been created and is the first addition of an entirely new index to the TSX since 2020. Key results across all groups are described below.
Key Results: National Trend
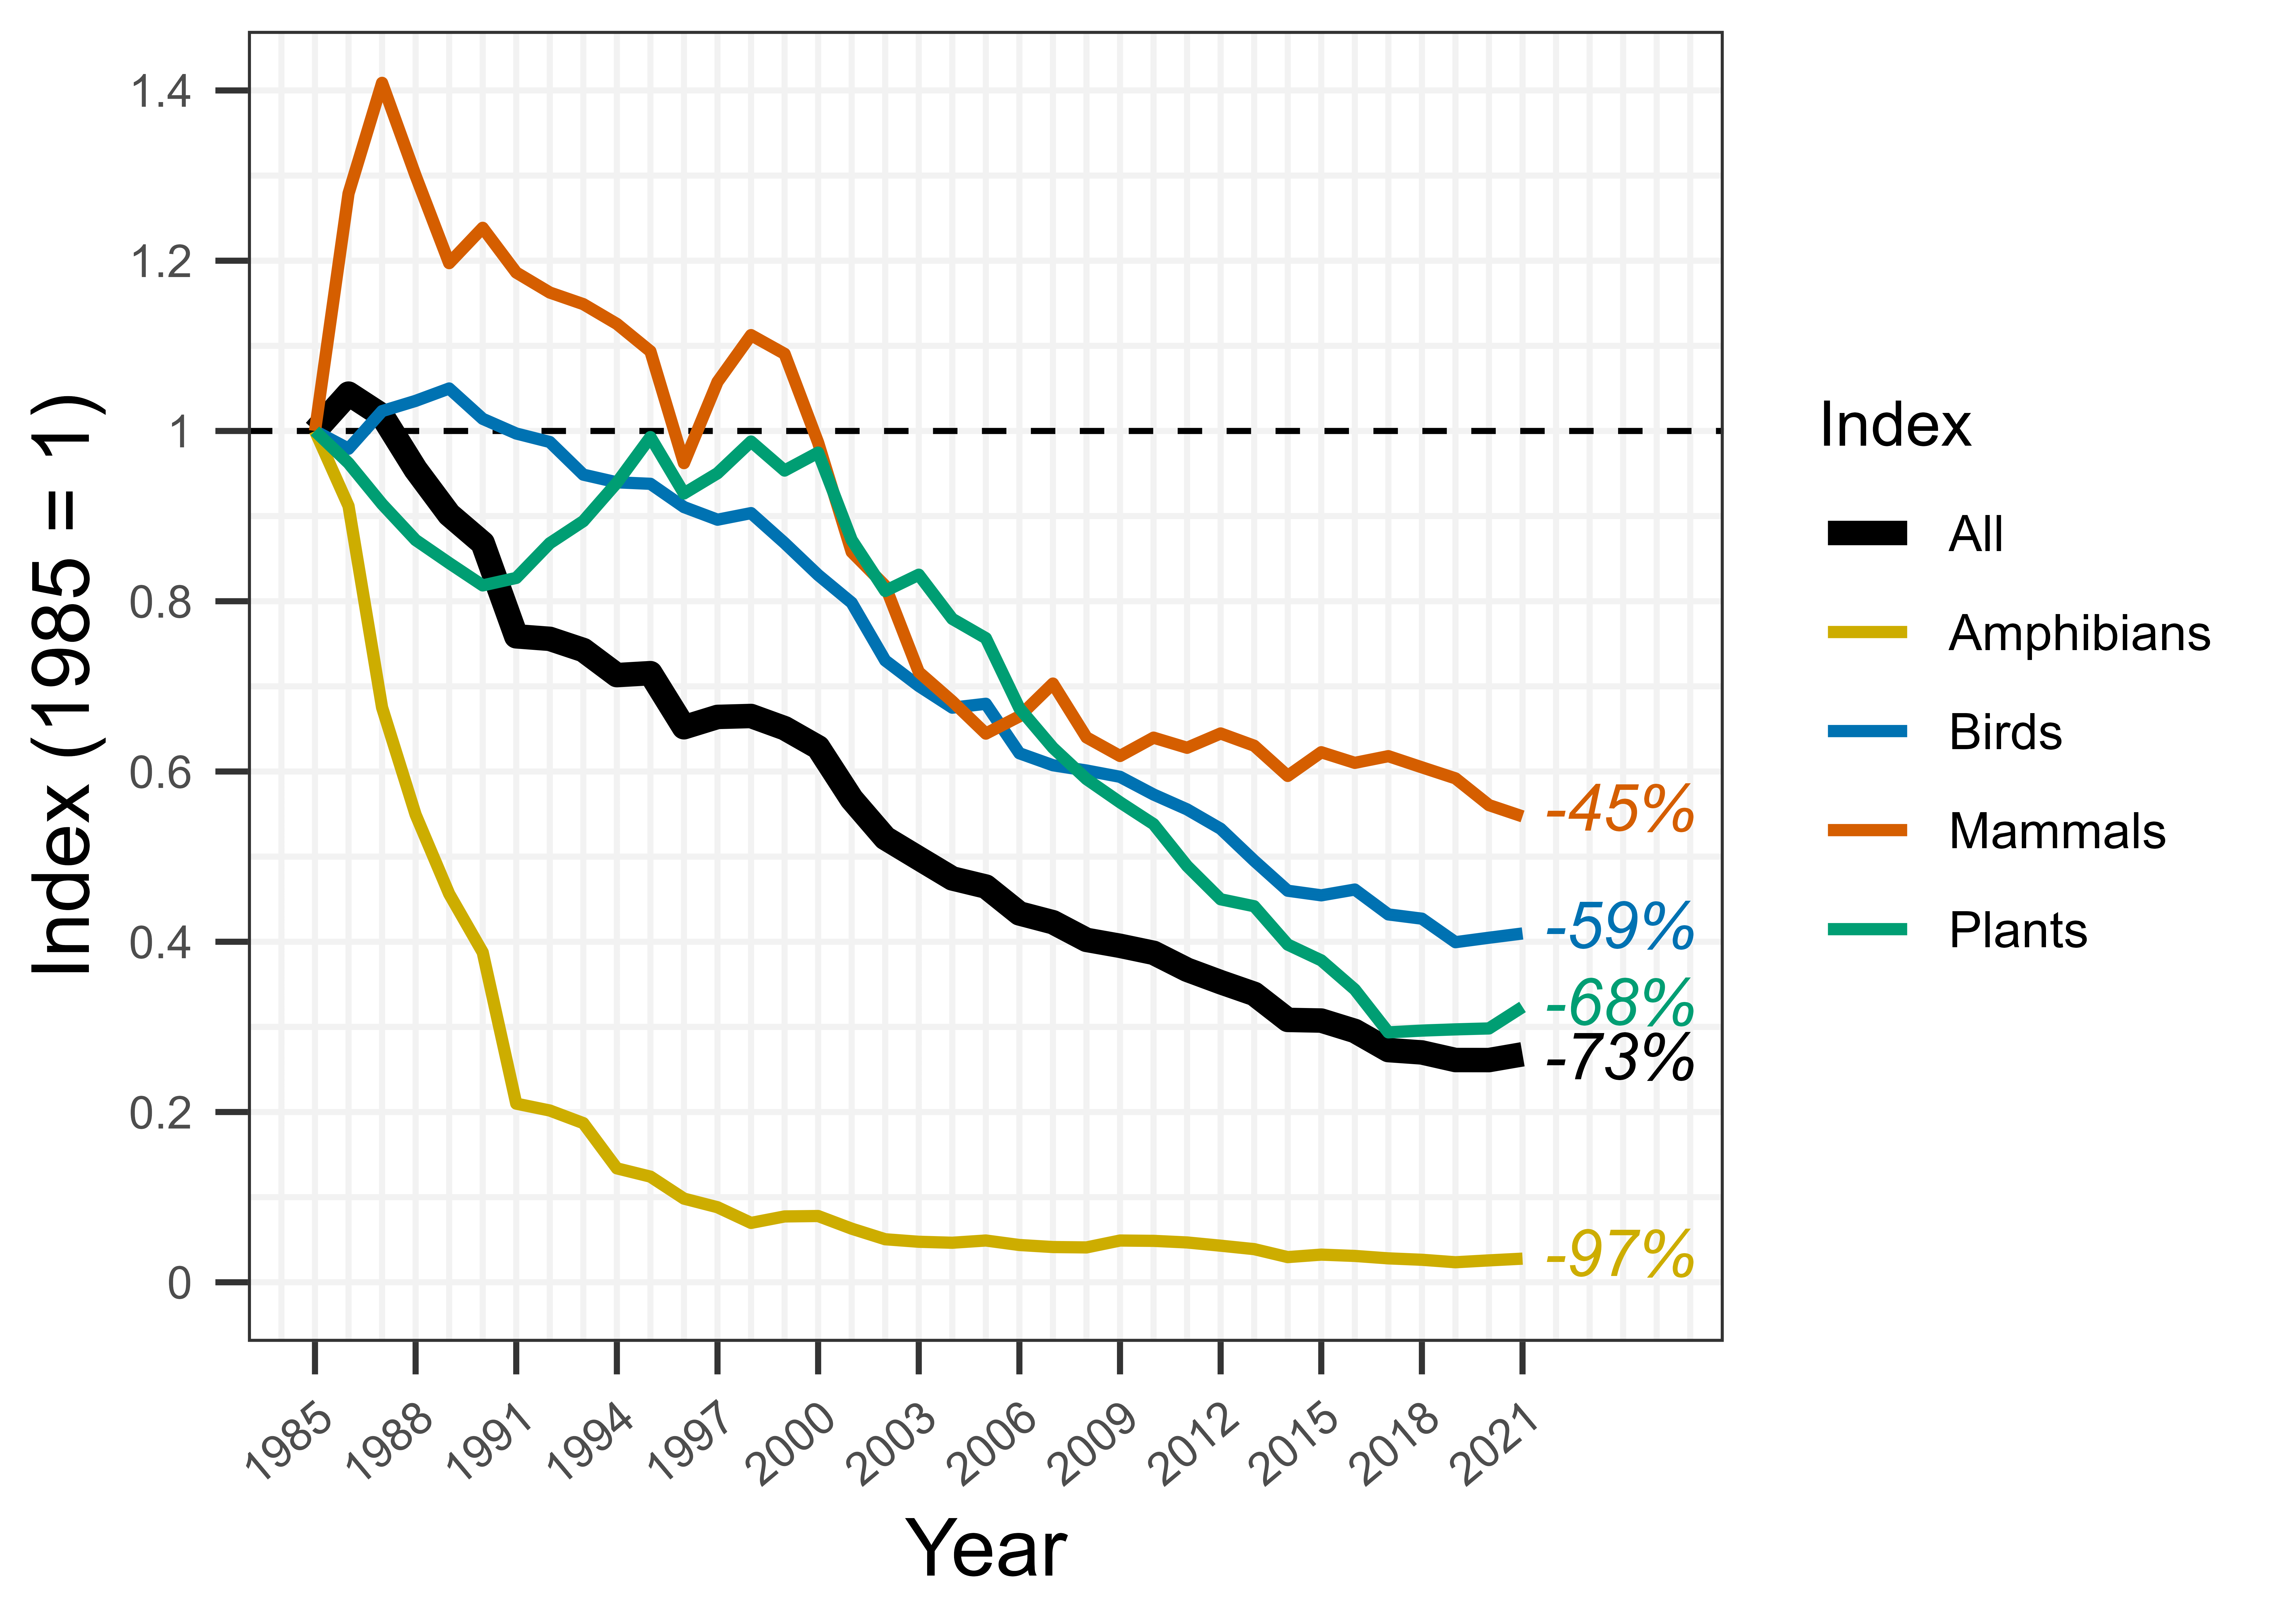
At the national scale, threatened and near-threatened species have experienced significant long-term losses, with an average decline of 73% in relative abundance since 1985 for the 335 taxa represented. Overall, the abundance of threatened and near-threatened species in the TSX dataset has declined by 1.8% per annum between 2000 and 2021. The full set of trends for the 2024 index can be explored using the TSX trend visualiser tool below.
TSX Trend Visualiser ToolFigure 1 (right): The Threatened Species Index 2024, showing trends up to 2021 across all taxa and separately for birds, mammals, plants, and amphibians. Each line shows the average change in relative abundance compared to the baseline year of 1985 where the index value is set to 1.

Bird TAXA
MAMMAL TAXA
PLANT TAXA
AMPHIBIAN TAXA
EPBC LISTED TAXA
IUCN LISTED TAXA
NUMBER OF TIME SERIES
NUMBER OF SOURCES
Key Results: Species Groups
The TSX currently includes data for threatened and near-threatened birds, mammals, plants and amphibians.
BIRDS
The trend for birds follows a similar shape to the main index, with an average decline in relative abundance of 59% since 1985 across the 73 taxa represented. Overall, birds have declined by an average 2% per annum between 2000 and 2021.

Figure 2: The Threatened Species Index 2024 based on all data provided on threatened and near-threatened bird taxa. The blue line shows the average change in relative abundance compared to the baseline year of 1985 where the index value is set to 1. The shaded areas show the confidence limits.
MAMMALS
Across the 86 mammal taxa for which the TSX has data, the average decline in relative abundance is 45% since 1985. Overall, mammals have declined by an average 2.1% per annum between 2000 and 2021 but have displayed an overall relatively stable trend since 2005.

Figure 3: The Threatened Species Index 2024 based on all data provided on threatened and near-threatened mammal taxa. The orange line shows the average change in relative abundance compared to the baseline year of 1985 where the index value is set to 1. The shaded areas show the confidence limits.
PLANTS
Across the 149 plant taxa for which the TSX has suitable data, the average decline in relative abundance is 68% since 1985. Overall, plants have declined by an average 3.1% per annum between 2000 and 2021.

Figure 4. The Threatened Species Index 2024 based on all data provided on threatened and near-threatened plant taxa. The green line shows the average change in relative abundance compared to the baseline year of 1985 where the index value is set to 1. The shaded areas show the confidence limits.
AMPHIBIANS
The trend for amphibians shows a precipitous decline through to 2000. For the 27 taxa covered by the current dataset, relative abundance has declined by 97% on average since 1985. Overall, amphibians have declined by an average 0.2% per annum between 2000 and 2021.

Figure 5. The Threatened Species Index 2024 based on all data provided on threatened and near-threatened amphibian taxa. The yellow line shows the average change in relative abundance compared to the baseline year of 1985 where the index value is set to 1. The shaded areas show the confidence limits.
Key Results: States and Territories
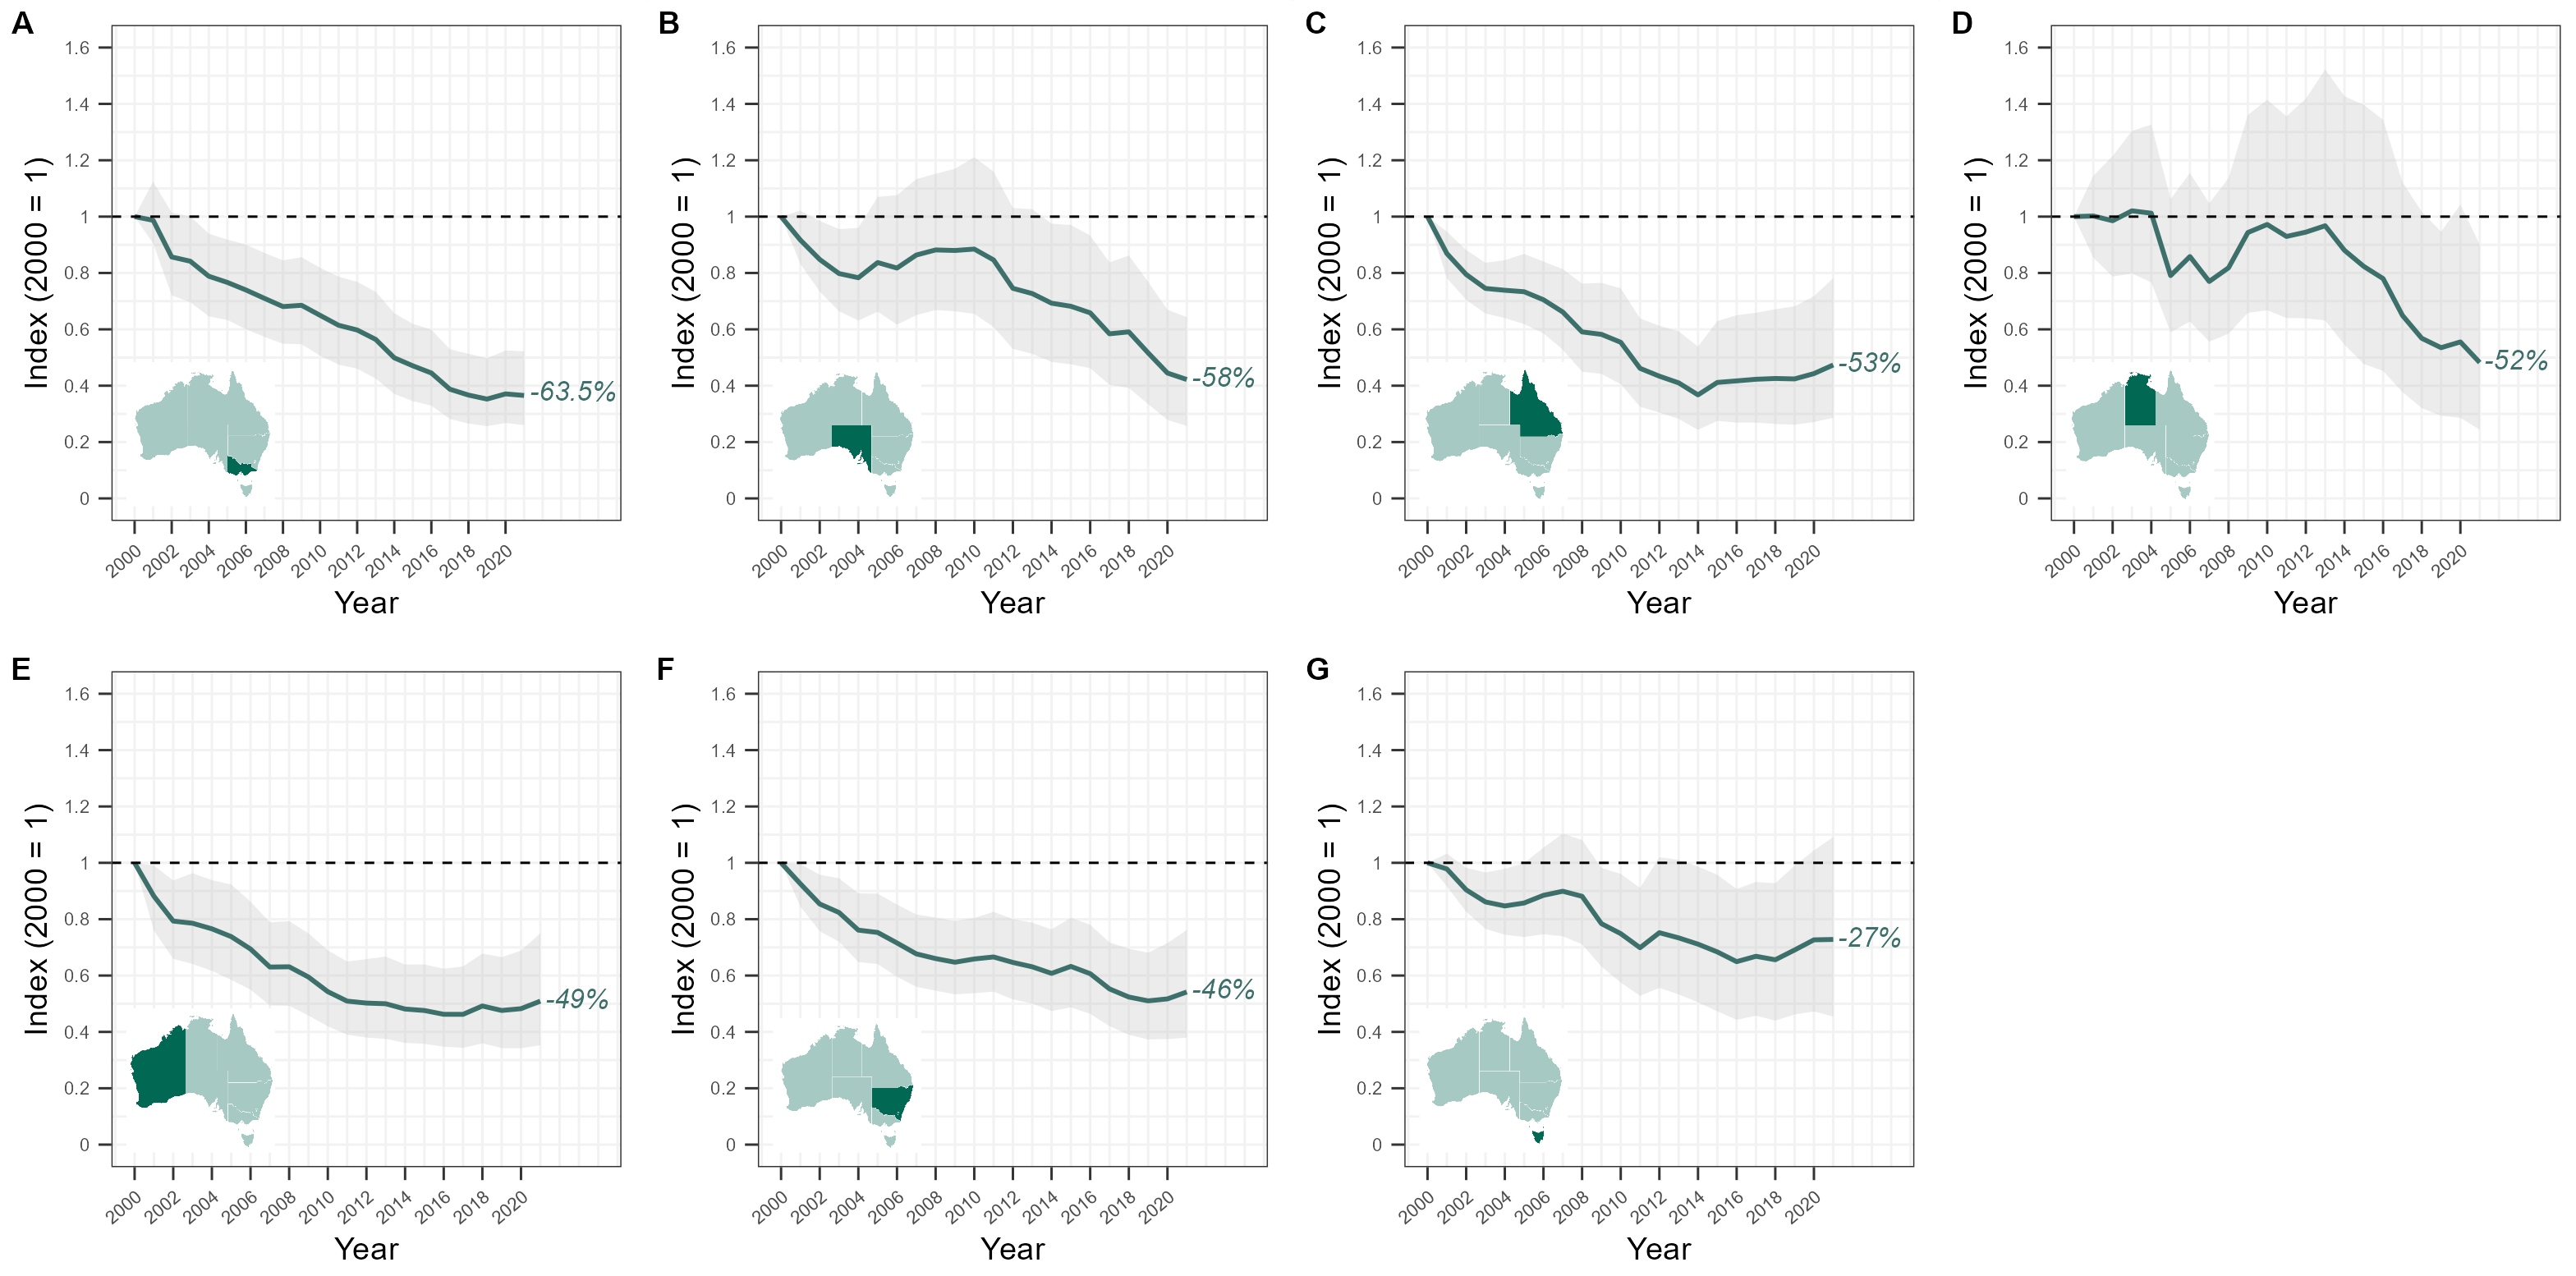
Despite large variation in species and ecosystems represented by Australia’s states and territories, there is remarkable consistency in the trends. South Australia, Queensland, the Northern Territory, Western Australia and New South Wales + ACT show average declines in relative abundance ranging from 45% to 58% since 2000. Victoria exhibited the most pronounced losses, with an average decline of 63.5% in the relative abundance of threatened and near-threatened species since 2000. In contrast, data held for Tasmania suggest an average decline of 27% across the 34 taxa represented for the state.

Figure 6: The Threatened Species Index 2024 for each state and territory between 2000 and 2021; A) Victoria, B) South Australia, C) Queensland, D) the Northern Territory, E) Western Australia, F) New South Wales and the Australian Capital Territory, and G) Tasmania. The green lines show the average change in relative abundance compared to the baseline year of 2000 where the index value is set to 1. The shaded areas show the confidence limits.
Additional Resources
PDF, 0.5MB
PDF, 5MB
PDF, 2.9MB

