09 December 2024
Australia’s first Threatened Frog Index
The TSX brings together thousands of monitoring datasets from across Australia and releases trend updates annually. In 2024, along with updates to the existing groups, a pilot Threatened Frog Index has been created. This is the first addition of an entirely new index to the TSX since 2020. Key results are described below.
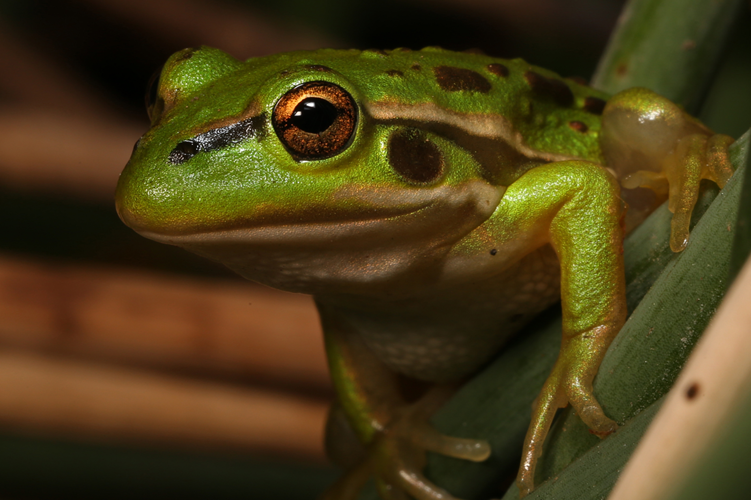
Growling Grass Frog (Litoria raniformis). Photo credit: Geoff Heard.

Key Results
Among the 27 taxa of threatened and near-threatened frogs covered by the current dataset, relative abundance has declined by 97% on average from a reference year of 1985. Declines were precipitous through to around 2000. While there has been some stabilisation after 2000, declines are ongoing, albeit at a slower pace. The very large decline overall is due to (i) the collapse of numerous frog populations due to amphibian chytrid fungus in the late 1980s and 1990s; (ii) the lack of recovery for many of these species; and (iii) continued decline of others in more recent years. The full set of trends for the pilot TFX can be explored using the TSX trend visualiser tool below.
TSX Trend Visualiser ToolFigure 1 (left): The pilot Threatened Frog Index 2024, showing trends up to 2021 across all taxa. The yellow line shows the average change in relative abundance compared to the baseline year of 1985 where the index value is set to 1. The shaded areas show the confidence limits.
AMPHIBIAN TAXA
Chytrid impacted TAXA
Chytrid non-impacted taxa
EPBC LISTED TAXA
National priority taxa
IUCN LISTED TAXA
number of time series
number of sources
The National TFX Dataset
The national trends are based on 587 time-series obtained from monitoring of 27 taxa (Figure 2). Collated data are primarily from eastern Australia, in line with the distribution of threatened and near-threatened Australian frogs.
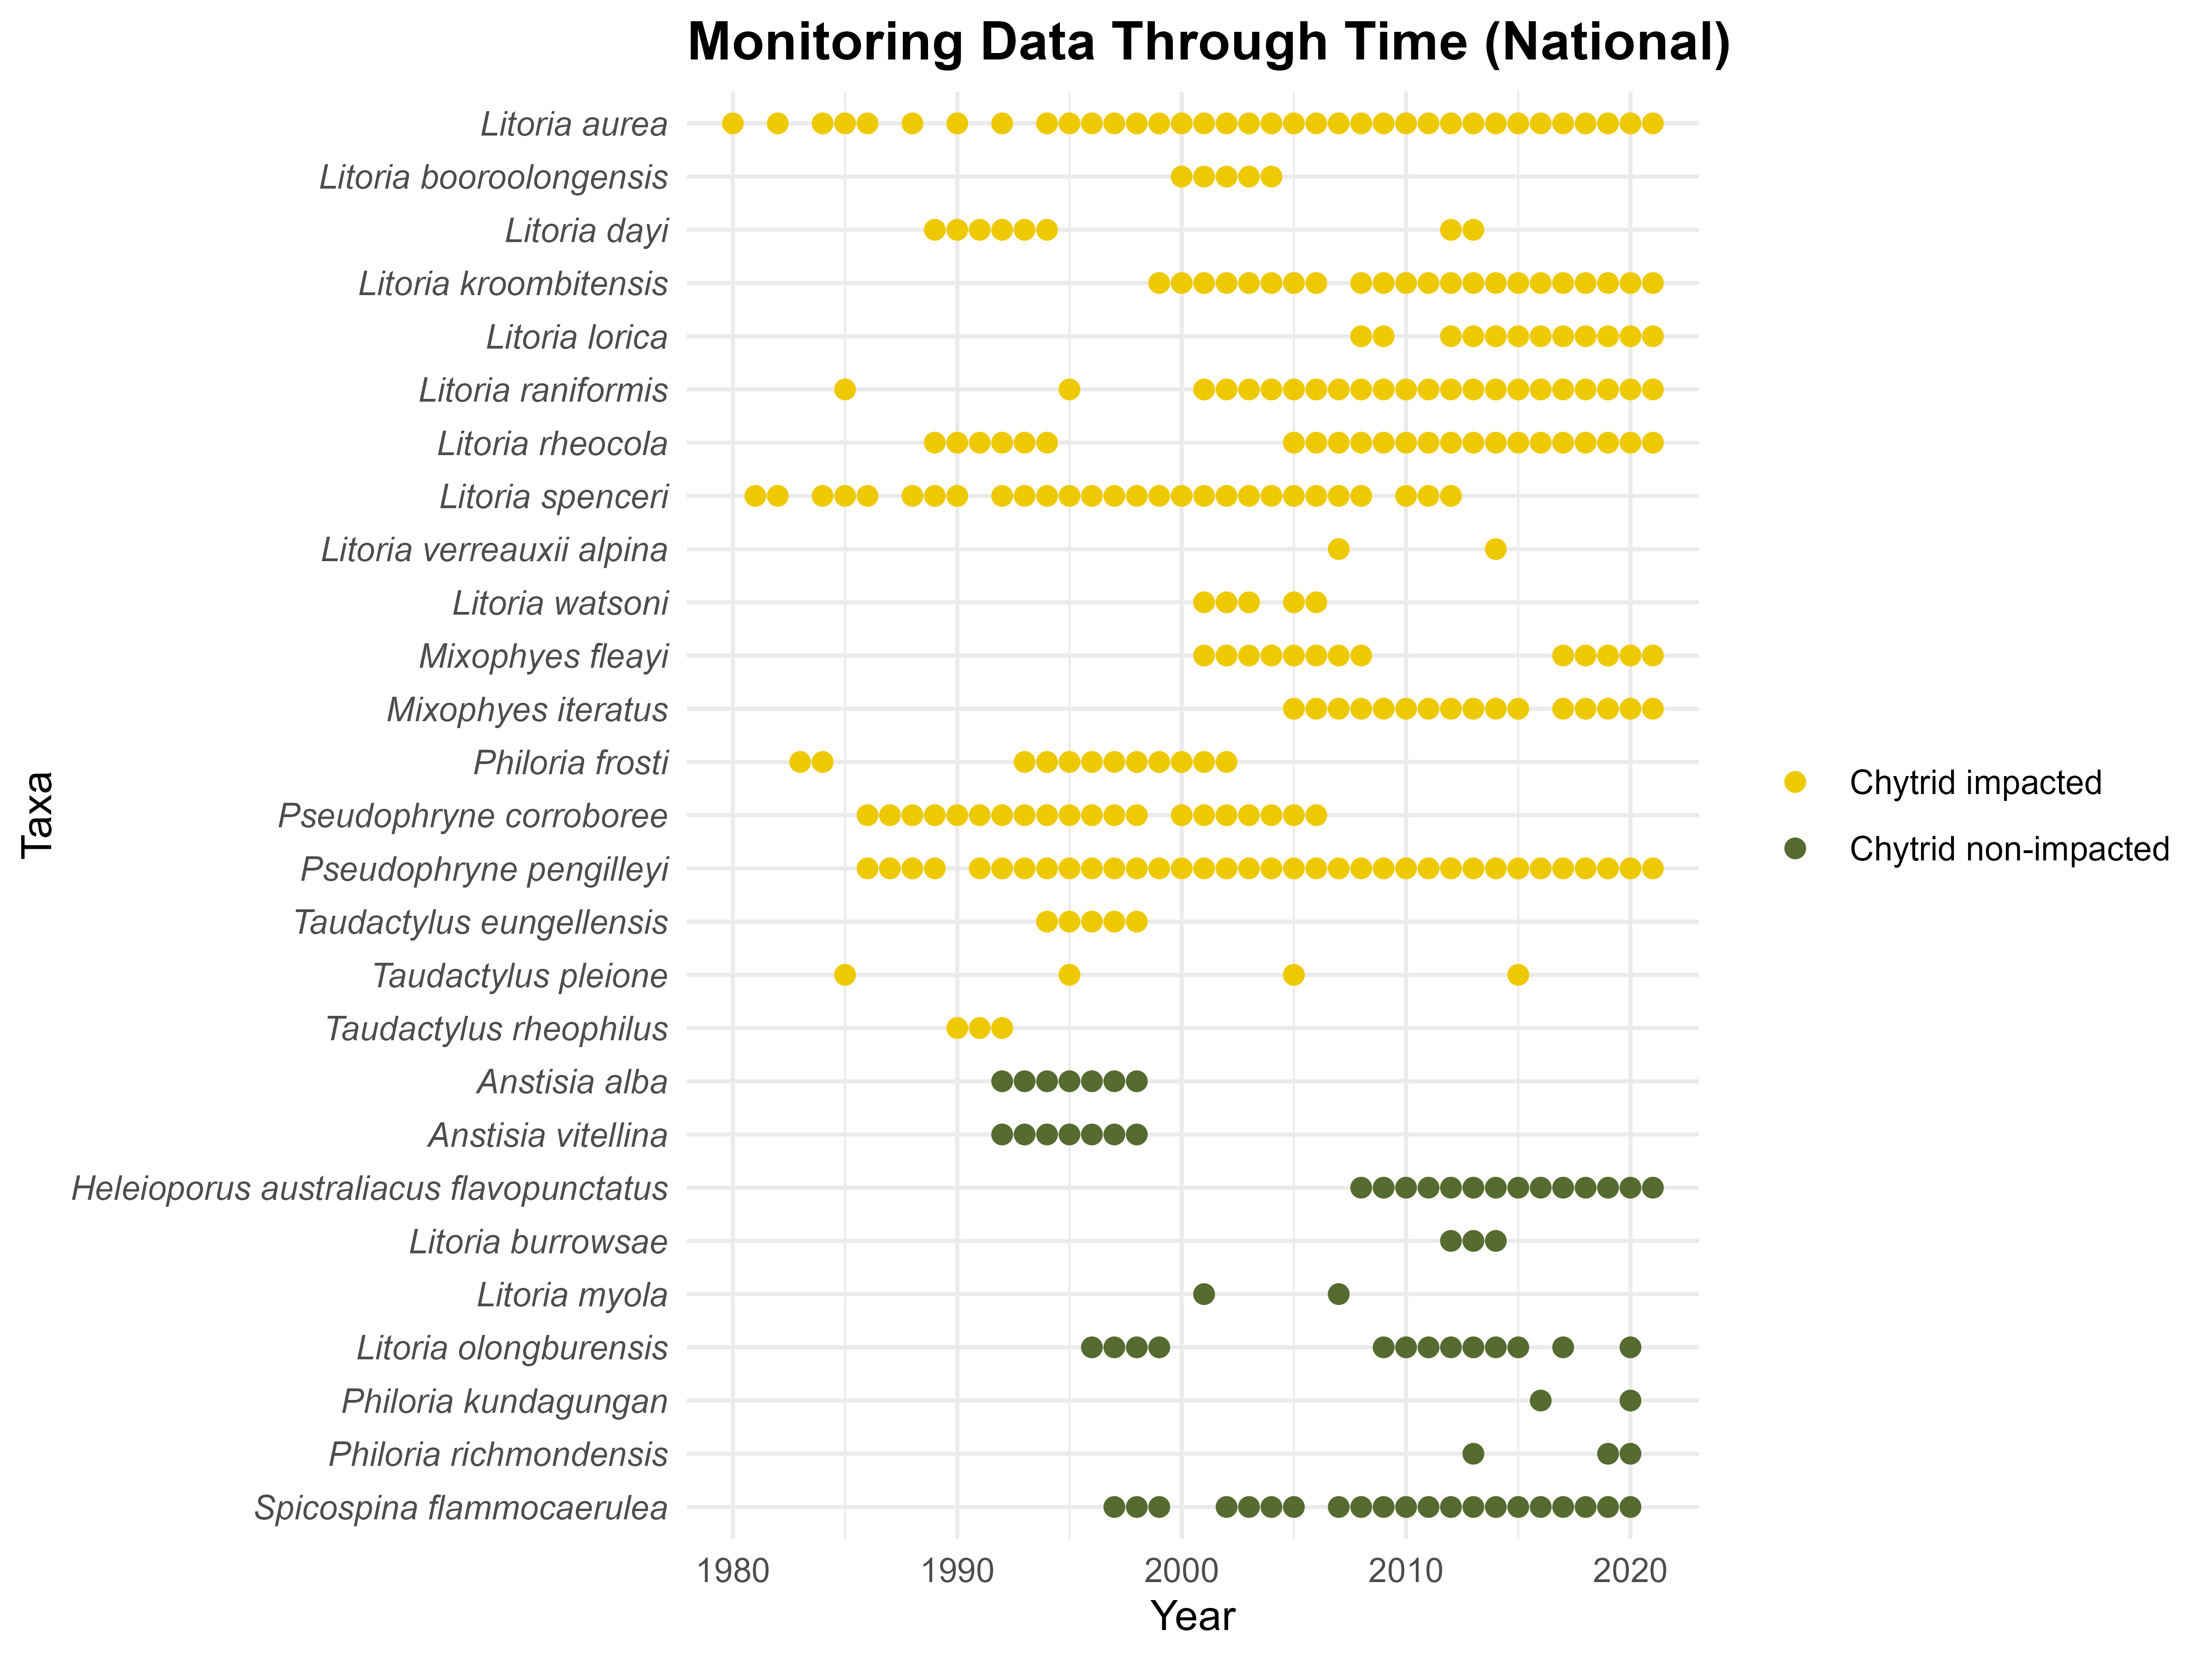
Figure 2: The temporal coverage of monitoring data acquired for threatened and near-threatened frogs across Australia. Note the significantly greater amount and temporal coverage of monitoring data for chytrid impacted taxa, and the fact that monitoring data for chytrid non-impacted taxa is only available from 1992 onwards in this pilot index.
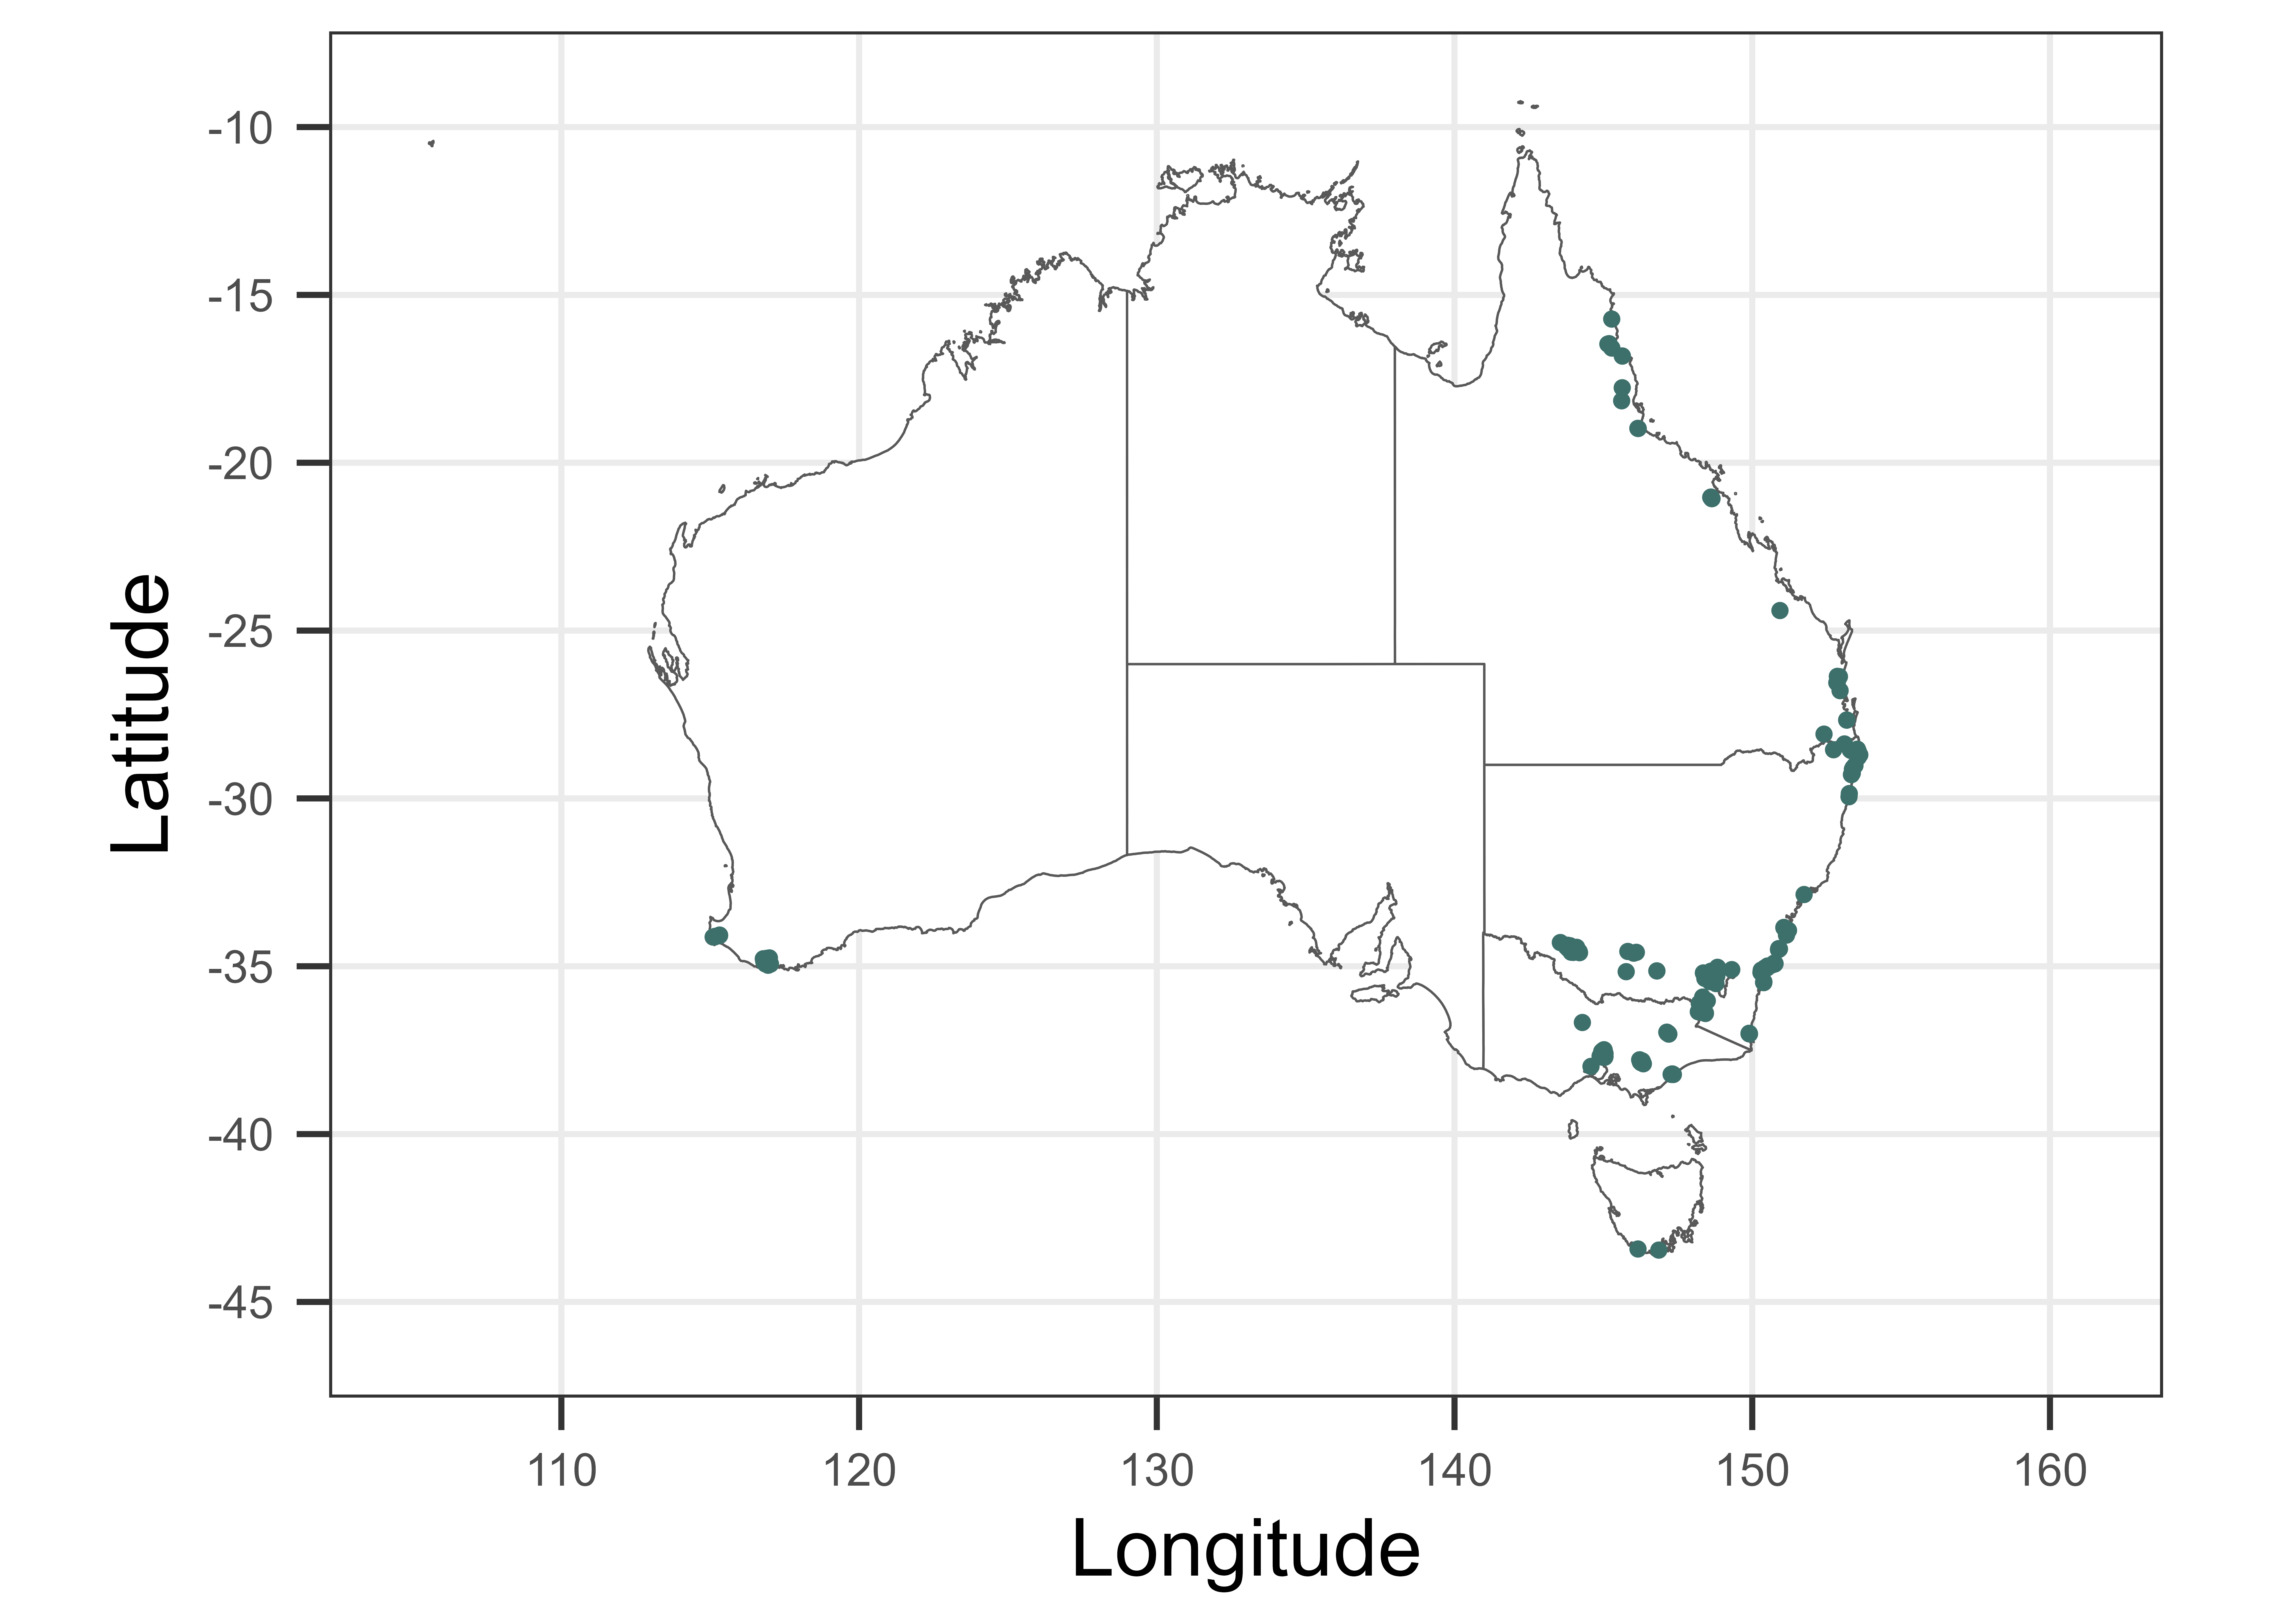
Figure 3: A map showing where the threatened frog data were recorded in Australia. The green dots indicate repeatedly monitored sites.
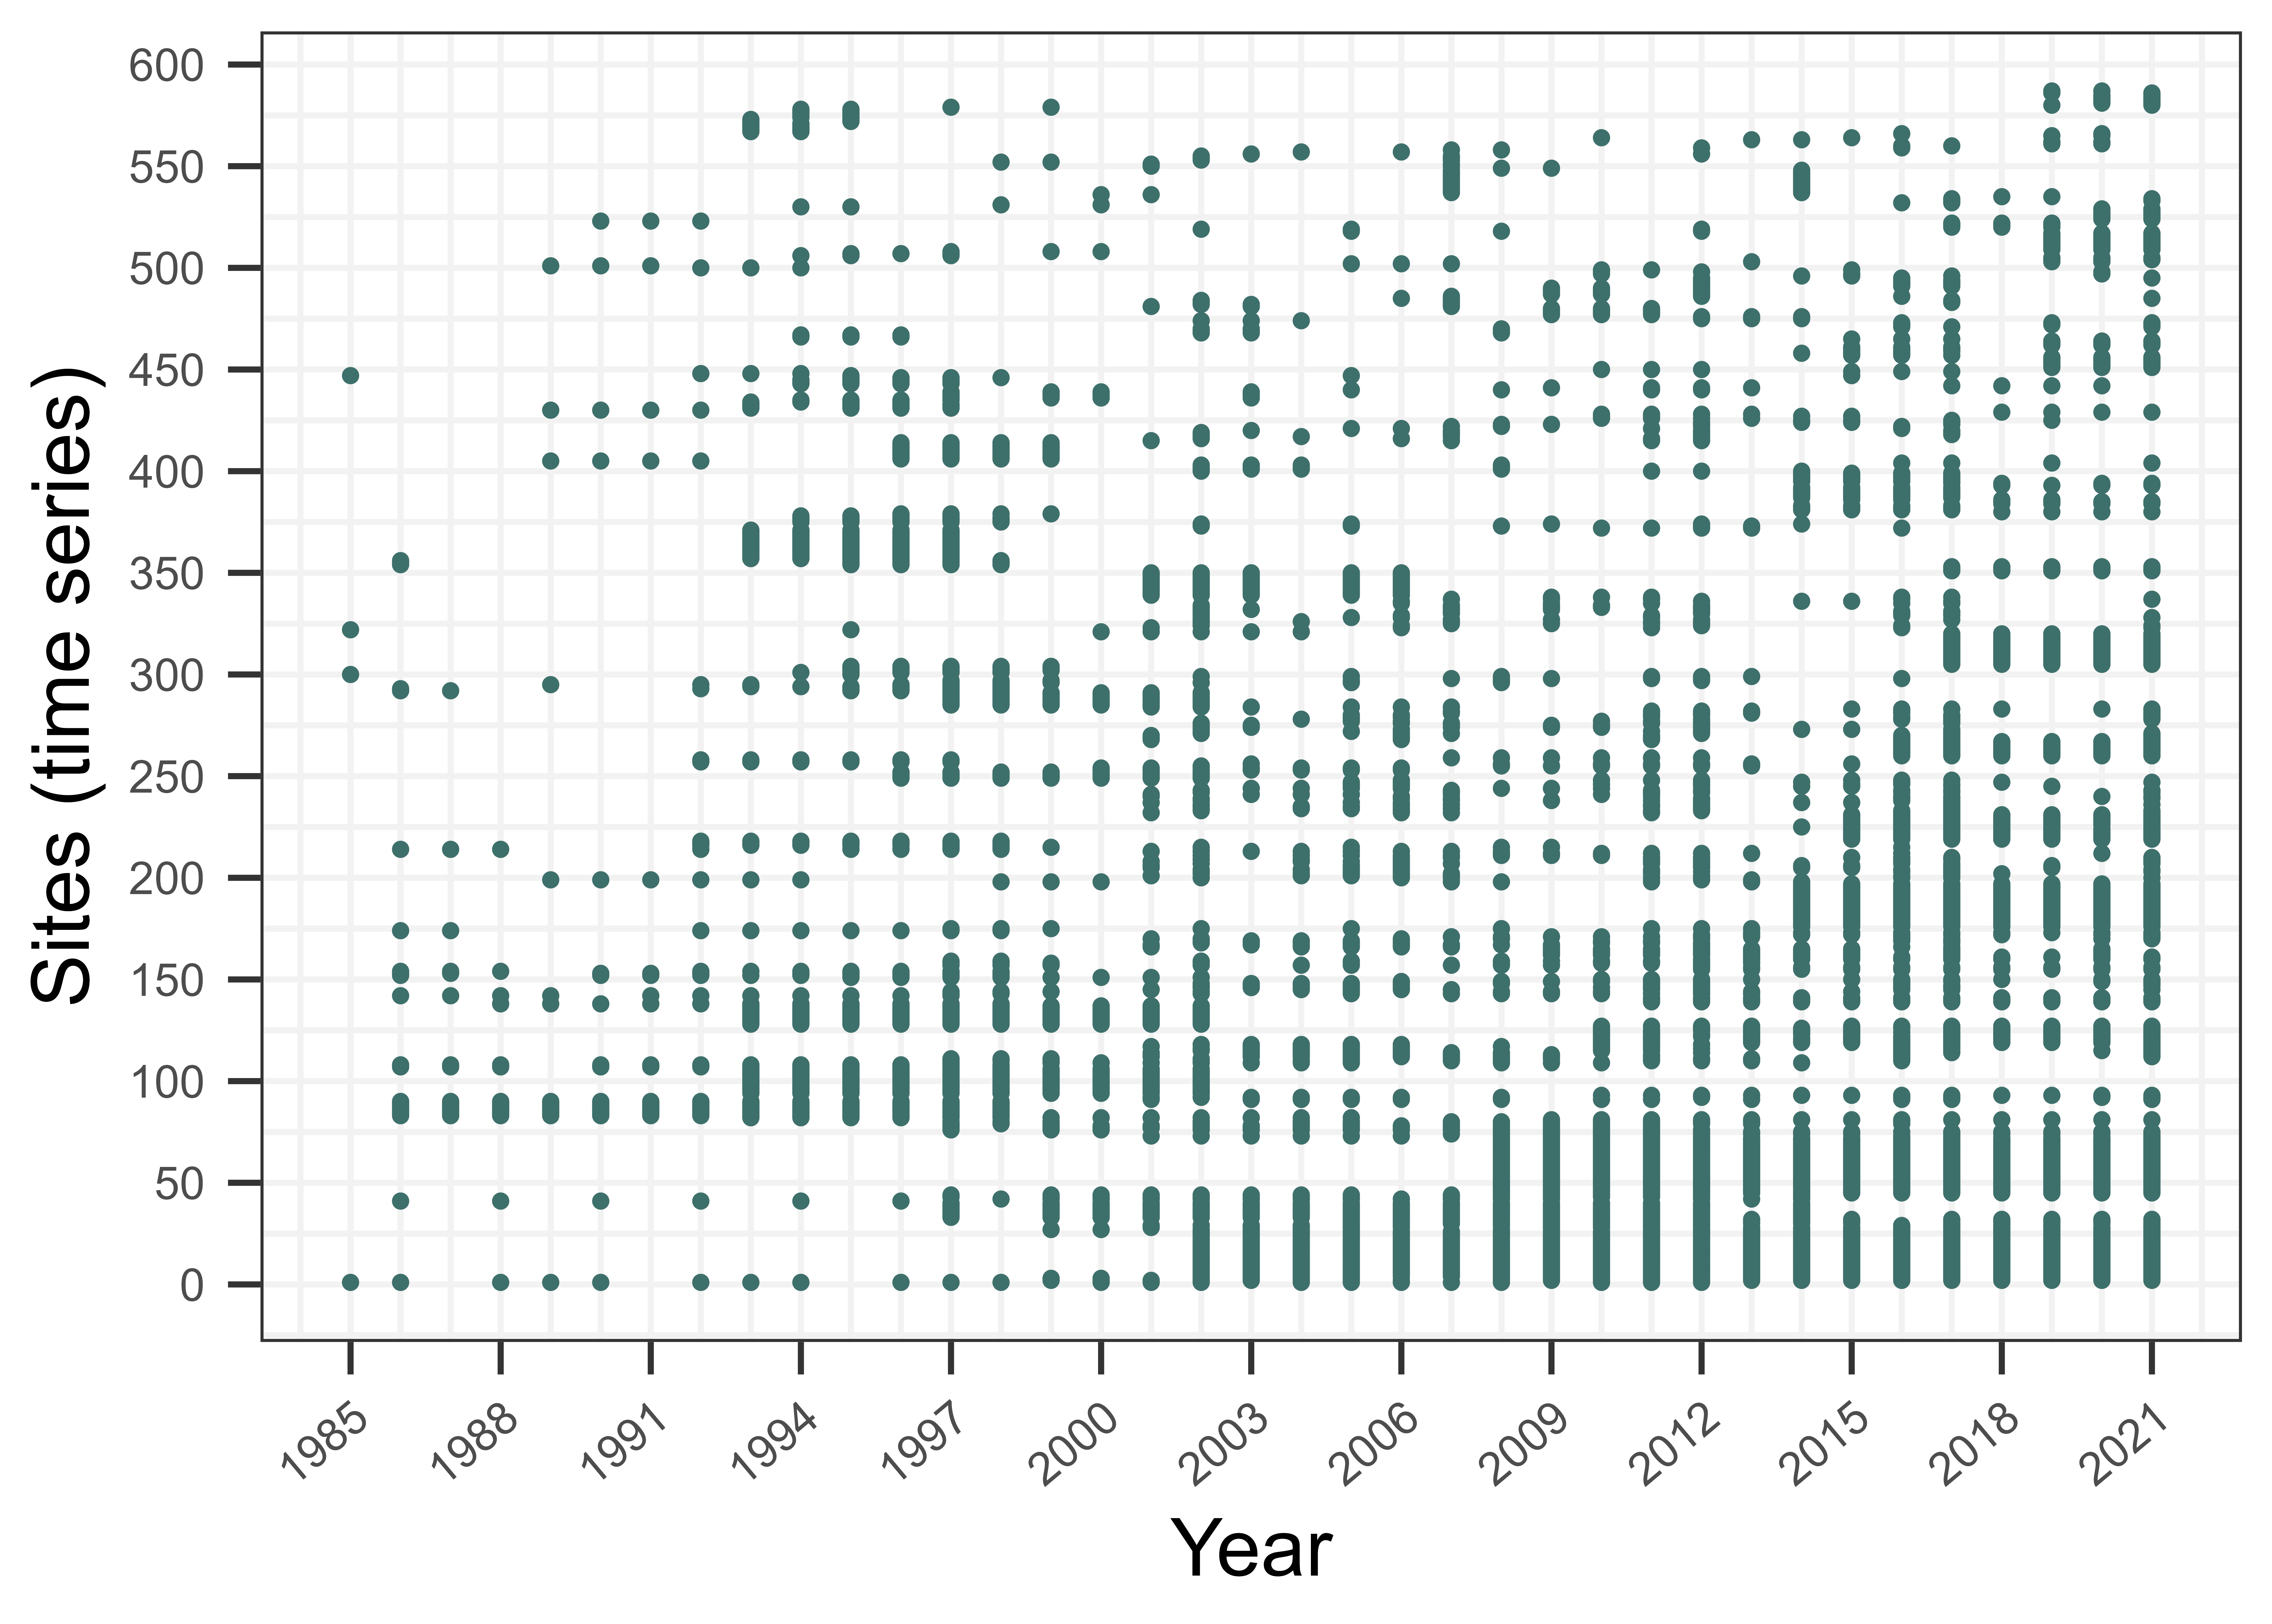
Figure 4: A dot plot showing the years for which monitoring data were available to compile the index. Each row represents a time series where a taxon was monitored with a consistent method at a single site in Australia.
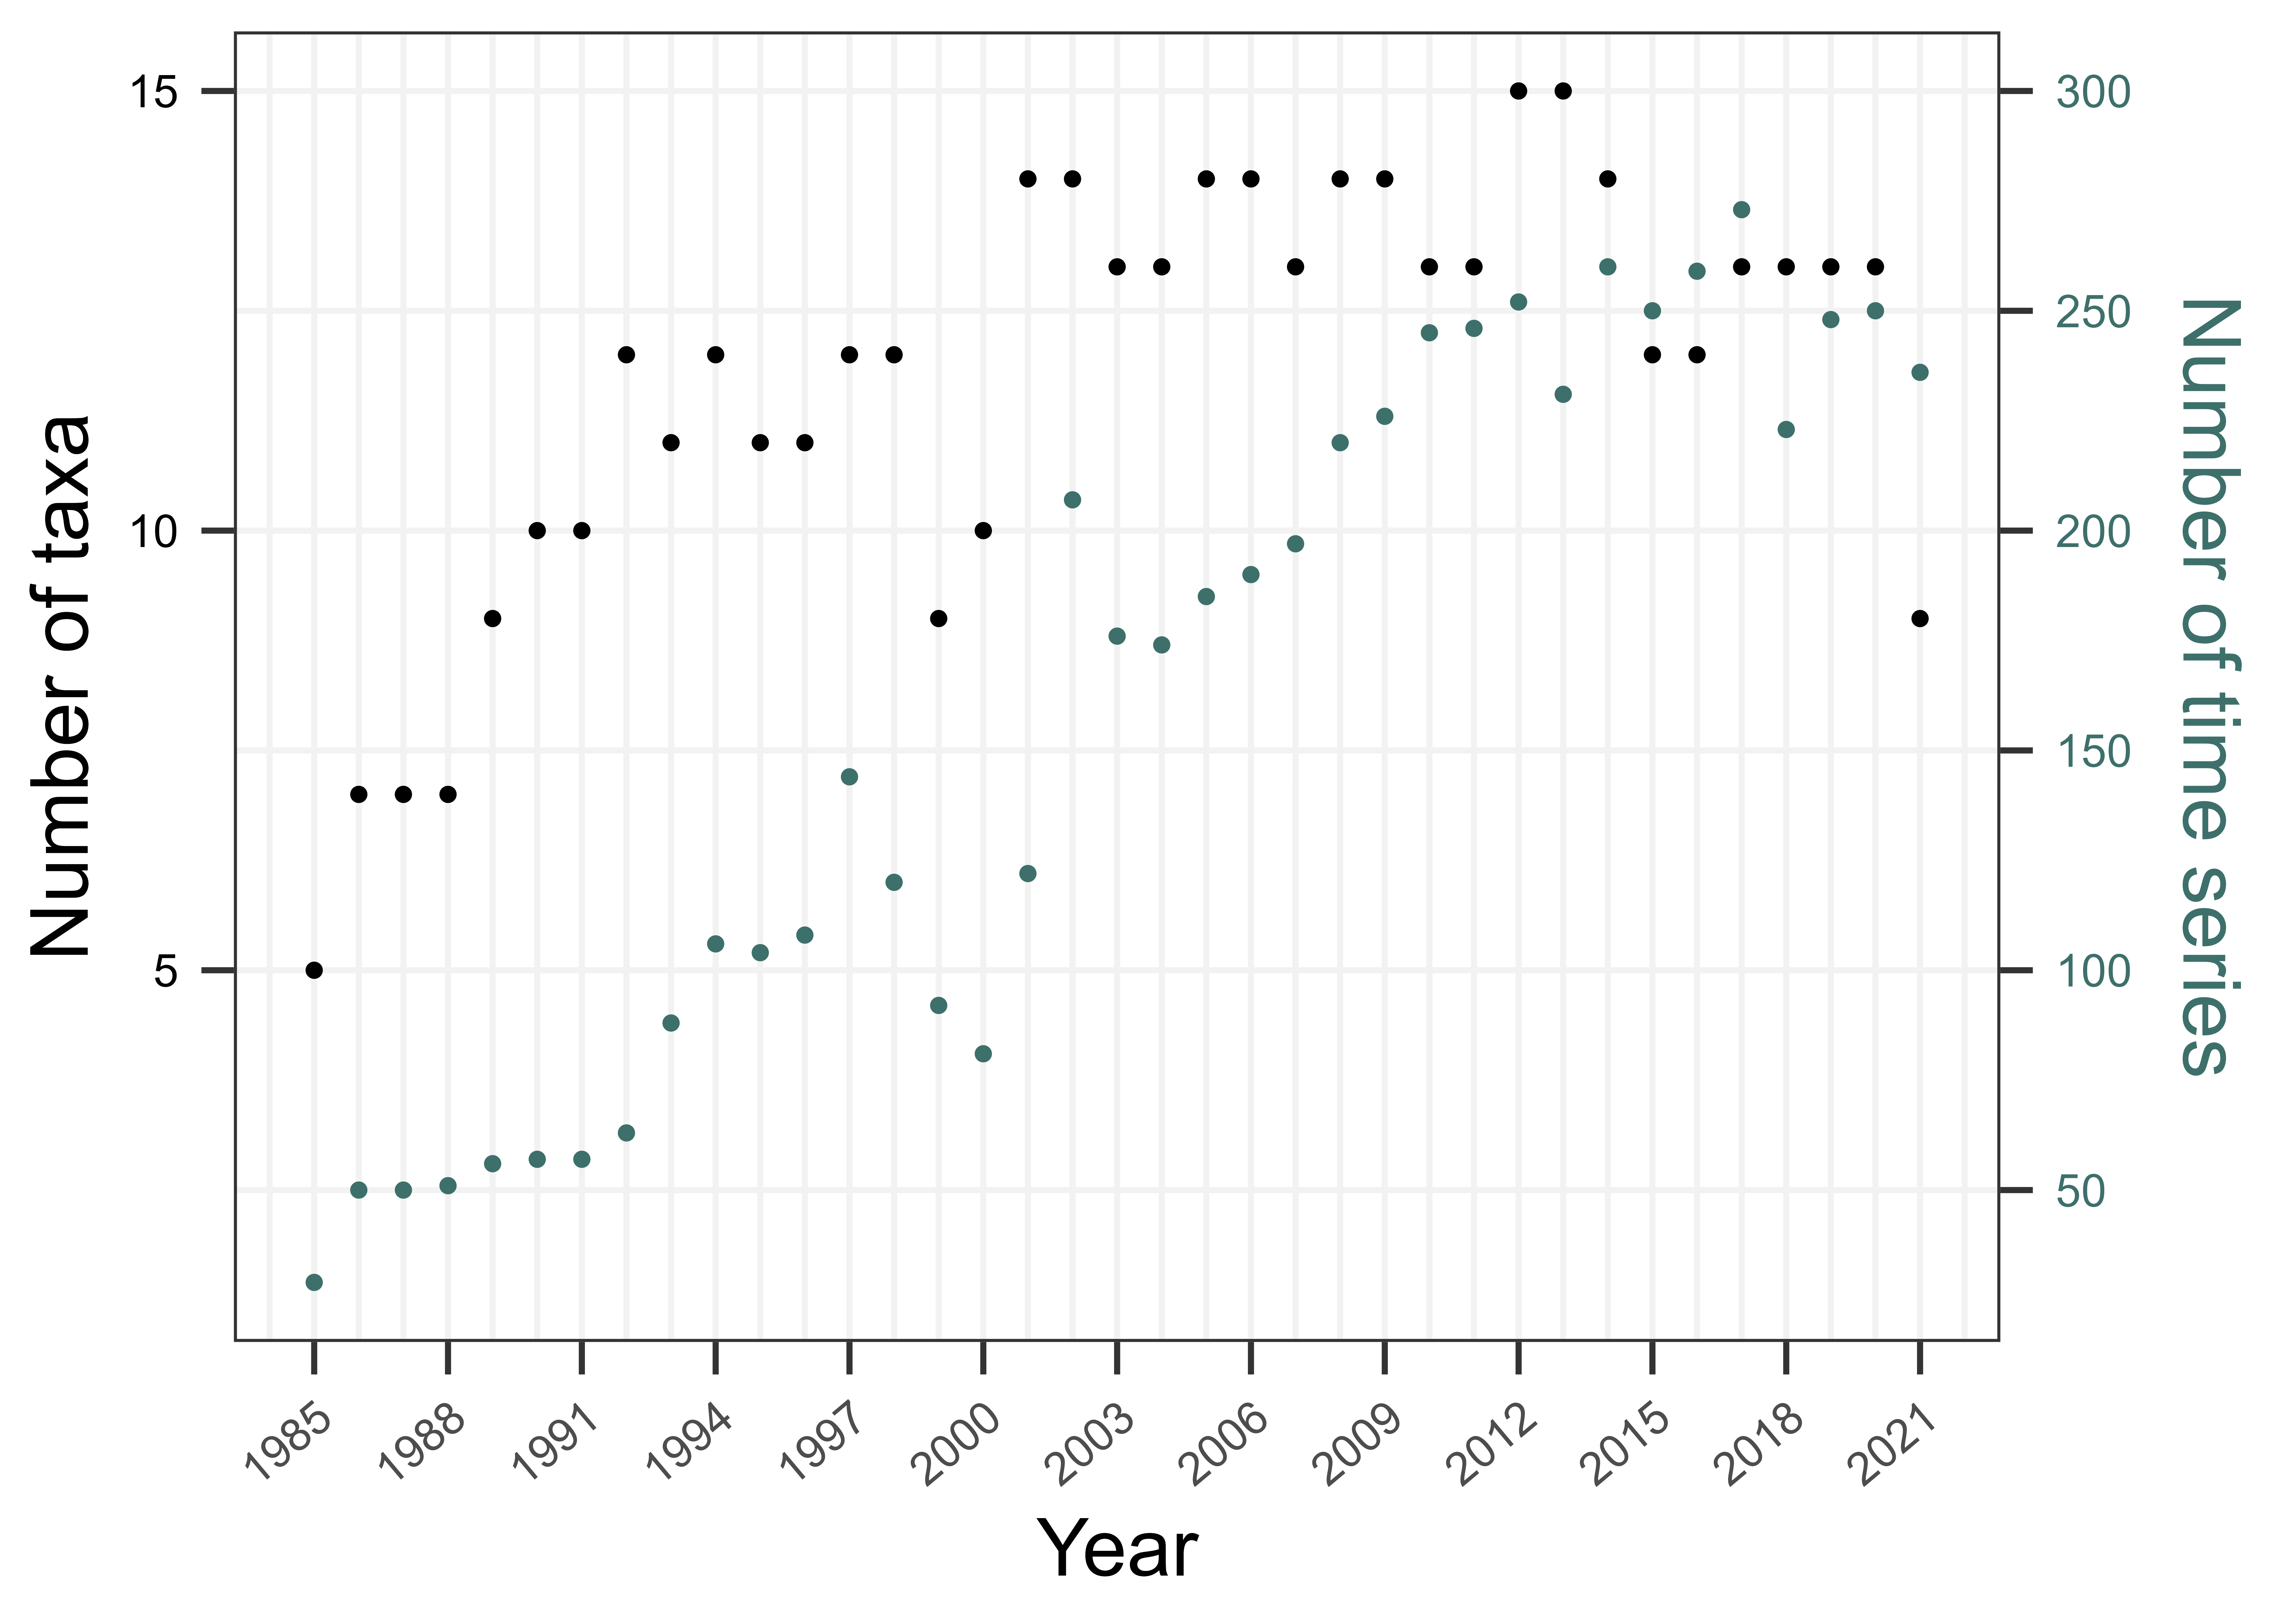
Figure 5: The number of taxa (in black circles) and number of time series (in green circles) used to calculate the index for each year.

